How to measure lift in an A/B test (with a Shopify example)
The A/B test lift formula, a worked Shopify example where conversion and revenue lift disagree, and how to turn a measured lift into monthly dollars.

Rishi Babu
The lift formula, worked through
Lift is a relative change. It answers "how much better, compared with what we had?"
Lift = (variant result − control result) ÷ control result
Say you run a matcha brand that sells 50 g and 150 g tins. The product page has always preselected the 150 g tin, and you suspect first-time buyers bounce at the big-tin price. So you test a variant that preselects the 50 g tin instead. It runs for three weeks with 20,000 product page sessions in each version:
- Control: 560 orders from 20,000 sessions, so the conversion rate is 2.80%.
- Variant: 630 orders from 20,000 sessions, so the conversion rate is 3.15%.
- Difference: 3.15% − 2.80% = 0.35 percentage points.
- Lift: 0.35 ÷ 2.80 = 0.125, so +12.5%.
A negative result works the same way. A variant at 2.52% against a 2.80% control is (2.52 − 2.80) ÷ 2.80 = −10%.
Percentage points or percent: say which one
The same test can be reported as "+0.35%" or "+12.5%", and both get called lift. The first is the absolute change in percentage points. The second is the relative change.
Mixing them up causes real arguments. "Conversion is up 0.35%" in a Slack thread sounds like noise, while "conversion is up 12.5%" sounds like a win, and they describe the same result. Write "pp" when you mean points and "relative" when you mean percent, and the thread stays short.
Most testing tools report relative lift. Sample size calculators usually ask for it too, as the minimum detectable effect. Our sample size calculator takes the relative lift you hope to detect and tells you how many visitors that needs.
Which metric to measure lift on
Conversion rate is the easiest lift to compute and the easiest to fool yourself with. The matcha test shows why. Here's the same test on order value and revenue:
- Control revenue: $33,600 from 560 orders, so average order value (AOV) is $60.
- Variant revenue: $35,280 from 630 orders, so AOV is $56.
- AOV lift: (56 − 60) ÷ 60 = −6.7%.
- Control revenue per visitor: $33,600 ÷ 20,000 = $1.68.
- Variant revenue per visitor: $35,280 ÷ 20,000 = $1.764.
- Revenue per visitor lift: (1.764 − 1.68) ÷ 1.68 = +5.0%.
You can check step 6 another way. Revenue per visitor is conversion rate times AOV, so its lift is (1 + conversion lift) × (1 + AOV lift) − 1. That's 1.125 × 0.933 − 1, which comes out at about +5%.
So more people bought, each order was smaller, and the store still came out ahead. Just by much less than the headline said. If the variant had cut AOV to $52, revenue per visitor would have dropped even with the extra orders. That's why we judge most Shopify tests on revenue per visitor and keep conversion rate and AOV as the explanation of what happened.
If your margins differ a lot between products, go one step further and measure lift on gross profit per visitor. A cheaper tin with a thinner margin can win on revenue and lose on profit.
Check the lift is real before you celebrate
A measured lift is one draw from a noisy process. Run the matcha test again with different shoppers and you'd get a different number. Two checks tell you how much to trust this one.
First, did the test reach the sample size you set before launch, after at least two full weeks? Stopping early because the variant looks good is an easy way to record a lift that later disappears. The dashboard number swings most in the first few days, and stopping on a high swing locks in the luck.
Second, what does the confidence interval say? For the matcha test's conversion rates, the 95% interval on the difference runs from +0.02 to +0.68 percentage points. That's roughly +0.6% to +24% relative. It sits above zero, so the variant very likely converts better. It's also wide enough that the true lift could be tiny.
An interval that crosses zero means the test didn't show a difference either way. Don't report a lift from that test as a result. Report it as "not shown yet".
Why the lift you keep is usually smaller than the lift you measured
Even a clean test tends to overstate the winner. When you only ship variants that came out on top, you're picking the ones that drew lucky as well as the ones that are better. Statisticians call this the winner's curse. It's why the lift you see in your reports a few months after launch is often smaller than the number the test gave you.
A few things make it worse:
- Small samples. The less traffic, the wider the swings, and the more the winning number is luck.
- Novelty. Returning visitors click a changed page because it's new. That fades after a couple of weeks.
- Many variants. Test four versions against one control and the best of the four will look better than it is.
Don't try to measure lift after launch by comparing the month before to the month after. A Black Friday email, a TikTok spike or a price change on a competitor's store will swamp a 5% lift. If you need a live read, keep a holdout. Leave 5% or 10% of visitors on the old page for a few weeks and compare the two groups. Same dates, same traffic, so the gap between them is the lift.
Turn the lift into dollars
A lift becomes a decision once it's in dollars. For the matcha store, the product page gets about 58,000 sessions a month:
- Revenue per visitor gain: $1.764 − $1.68 = $0.084.
- Monthly gain: $0.084 × 58,000 = about $4,870 a month.
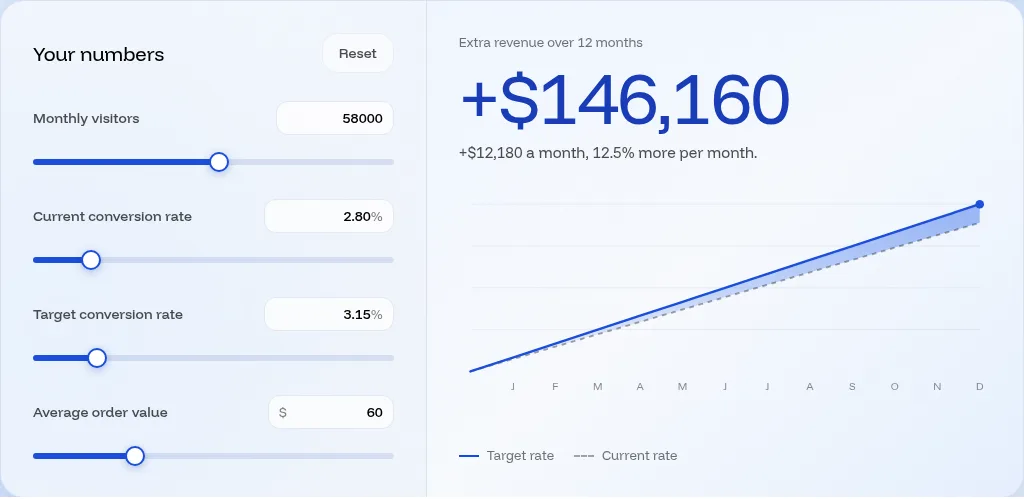
- Conversion-only estimate for comparison: 58,000 × 0.0035 × $60 = about $12,180 a month.
Step 3 is what you'd get from a calculator that holds order value fixed, like the screenshot at the top. It's more than double the real gain, because it ignores the smaller baskets.
Then repeat step 2 with the low end of the interval rather than the point estimate. If even the low end covers the cost of keeping the change (a design tweak costs nothing to keep, a new app subscription does), ship it.
Your next step
Open your last finished test and write down four numbers: the lift on conversion rate, the lift on AOV, the lift on revenue per visitor, and what the revenue per visitor lift is worth a month. If the first and third disagree, the third one wins.
That's what we do: our team researches your store, designs product page and cart tests, and measures every lift on real Shopify orders. AI speeds up the build, and you approve each test in Slack. We only charge when you make money. If you're curious what lift your store could find, book a call.