A/B testing confidence intervals: how to read your test result
What an A/B testing confidence interval means, the formula for conversion rate tests, a worked Shopify example, and how to turn the range into dollars.

Chirag Babu
What the interval adds to "95% significant"
Most testing dashboards lead with one number: "Variant B, +12.9%, 98.6% chance to win." That headline is the point estimate. It's the single most likely lift given the data, and it's almost never the lift you'll get.
The confidence interval puts a range around it. With the numbers above, +12.9% could be anything from a modest +2.6% to a very good +23%. Both ends matter. The significance figure only tells you whether zero is outside the range. The interval tells you how far outside, and how wide the range is.
One wording trap. A 95% interval doesn't mean "there's a 95% chance the true lift is in here". It means the method used to build it captures the true lift in 95% of tests. In practice, read it as "lifts outside this range don't fit the data well", and you won't go far wrong.
The formula for a conversion rate test
For two versions with conversion rates p₁ (control) and p₂ (variant), and n₁ and n₂ sessions in each:
95% CI = (p₂ − p₁) ± 1.96 × √( p₁(1 − p₁)/n₁ + p₂(1 − p₂)/n₂ )
The square root part is the standard error of the difference. Here's the product page test worked through. It's a skincare brand testing a new PDP layout that moves the "how to use it" block and the delivery estimate above the fold. Three weeks, 48,000 product page sessions split evenly:
- Control: 744 orders from 24,000 sessions, so p₁ = 0.0310.
- Variant: 840 orders from 24,000 sessions, so p₂ = 0.0350.
- Difference: 0.0350 − 0.0310 = 0.0040, or +0.40 percentage points.
- Standard error: √(0.0310 × 0.9690 ÷ 24,000 + 0.0350 × 0.9650 ÷ 24,000) = 0.00163.
- Margin: 1.96 × 0.00163 = 0.0032.
- Interval: 0.40 ± 0.32 points, so +0.08 to +0.72 percentage points.
To express it as a relative lift, divide by the control rate: +2.6% to +23.2%, around a point estimate of +12.9%. That shortcut ignores the noise in the control rate, so treat the relative range as approximate. Most tools report the relative version, which is why the absolute one is worth working out once. "+0.08 points" sounds a lot less exciting than "+12.9%". The lift formula walkthrough shows the same maths on revenue per visitor, where order value can change the answer.
Same lift, three sample sizes
The width of the interval comes almost entirely from sample size. Keep the rates at 3.10% and 3.50% and change only the traffic:
| Sessions per version | 95% interval (percentage points) | Relative lift, roughly | Verdict |
|---|---|---|---|
| 8,000 | −0.15 to +0.95 | −5% to +31% | Not shown. Could be a loss. |
| 24,000 | +0.08 to +0.72 | +3% to +23% | Likely a win, size unclear |
| 96,000 | +0.24 to +0.56 | +8% to +18% | Win, and you know roughly how big |
The 8,000 row is the one that bites smaller stores. Same 0.40 point gap, but the range runs from a 5% loss to a 31% win. Calling it after one week because the variant is "up 13%" is a coin flip with extra steps.
Quadrupling the sample halves the width. That's why we work out the sample size for an A/B test before launch and don't stop when the dashboard turns green. Our sample size calculator gives you the number for your baseline and traffic.
Turn the interval into dollars before you ship
Percentage points don't pay for anything, so translate both ends. Say the product pages get 48,000 sessions a month and the average order is $62:
- Low end, +0.08 points: about 38 extra orders, roughly $2,381 a month.
- Point estimate, +0.40 points: 192 extra orders, roughly $11,900 a month.
- High end, +0.72 points: about 346 extra orders, roughly $21,400 a month.
Now the decision gets practical. If the new layout is free to keep, ship it. Even the low end beats doing nothing. If it needs a $1,500 a month review app or a photo shoot for 200 SKUs, the low end barely covers it, and you might want more data first or a cheaper version of the same idea.
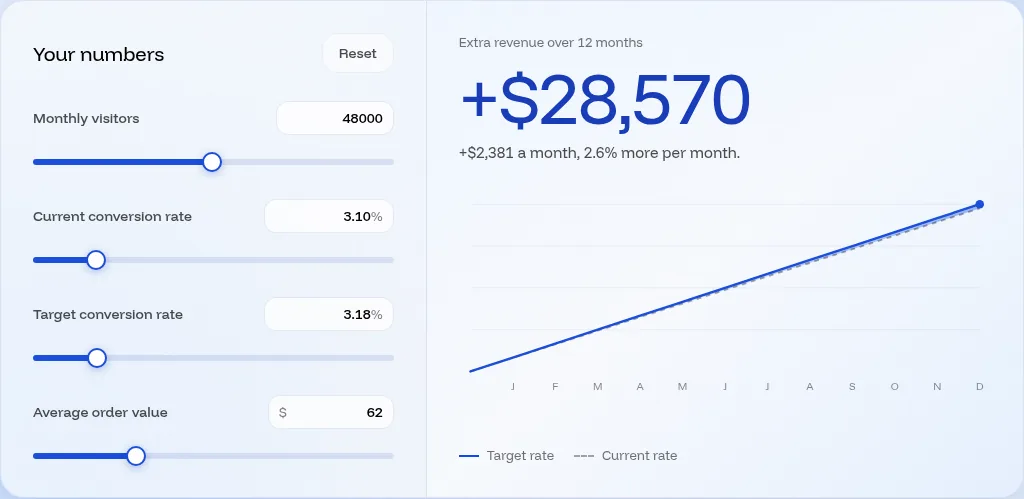
Our A/B testing ROI calculator does this conversion for you. Run it twice, once with each end of the interval. A free shipping threshold test, for example, only pays if the low end covers the postage you take on, and how to offer free shipping on Shopify is how you set that threshold up.
Revenue per visitor intervals are wider
Conversion rate is a yes or no for every session. Revenue per visitor isn't. Most sessions are worth $0, a few are worth $62 and the odd one is a $240 gift order. That spread makes the interval wider for the same traffic.
For revenue metrics the interval uses the means and standard deviations of revenue per session:
95% CI = (mean₂ − mean₁) ± 1.96 × √( s₁²/n₁ + s₂²/n₂ )
Same skincare test, 24,000 sessions in each version, with order values that vary.
- Control revenue per visitor is $1.92. The variant is $2.17. Difference: $2.17 − $1.92 = $0.25.
- The standard deviation per session is about $13 on the control and $14 on the variant.
- Standard error: √(13² / 24,000 + 14² / 24,000) = √(169 / 24,000 + 196 / 24,000) = √(365 / 24,000) = √0.01521 = $0.123.
- Margin: 1.96 × $0.123 = $0.24.
- Interval: $0.25 ± $0.24, so about +$0.01 to +$0.49 per visitor.
That interval sits just above zero, so the variant wins, but only just. It is not entirely below zero, which would be a loss, and it does not cross zero, which would be inconclusive. The conversion rate interval sat comfortably above zero. A range this close to zero is a weak win: the low end is about one cent per visitor.
We'd still judge most tests on revenue per visitor, because a variant that lifts conversion by nudging shoppers toward the cheaper kit can lose money. Just plan for it. Revenue metrics need more traffic before the interval is tight enough to act on, so size the test on the revenue number.
Mistakes that make the interval lie
Checking daily and stopping on the first good reading. The interval is only valid at the sample size you planned. Look every morning and stop the first time the range clears zero, and you'll call a lot of false winners. Fix the sample before launch and read the interval once, at the end.
Comparing three variants at 95% each. With a control and three variants, each comparison has its own 5% chance of a false win, so across the test the odds of at least one fake winner climb past 14%. The simplest fix is to divide the 5% by the number of comparisons and widen each interval to 98.3%, which uses 2.39 instead of 1.96.
Mixing up points and percent. "+0.4%" in a Slack update might mean 0.4 percentage points (a 13% lift) or a 0.4% relative lift (almost nothing). Write "pp" for points and say "relative" for percent.
Ignoring what happened during the test. An interval measures random noise, not a broken variant on Safari or a TikTok spike that sent the variant a different crowd for three days. Check device and traffic source splits before you trust any range.
Treating "not significant" as "no effect". A range of −0.15 to +0.95 points doesn't prove the change does nothing. It says this test couldn't tell. Bigger change, more traffic, or a page closer to the order are all fair next moves.
Read the low end first
Next time a test finishes, skip the headline number and write down three things: the interval in percentage points, what the low end is worth a month, and whether that covers what the change costs to keep. If the low end is above zero and pays for itself, ship it. If the range crosses zero, you have a "not yet", not a loser.
Cascayd's team researches your store and designs product page and cart tests big enough to give you an interval worth acting on. AI speeds up the build, you approve every test in Slack, and each one gets its sample size set up front, runs at least two weeks and is judged at 95% significance. We only charge when you make money. If you're curious whether your monthly traffic can deliver good testing results, book a call.