Sample size for A/B testing: how many visitors your Shopify test needs
How to work out the sample size for an A/B test before launch: the formula, a worked Shopify product page example, revenue per visitor, and low traffic.

Rishi Babu
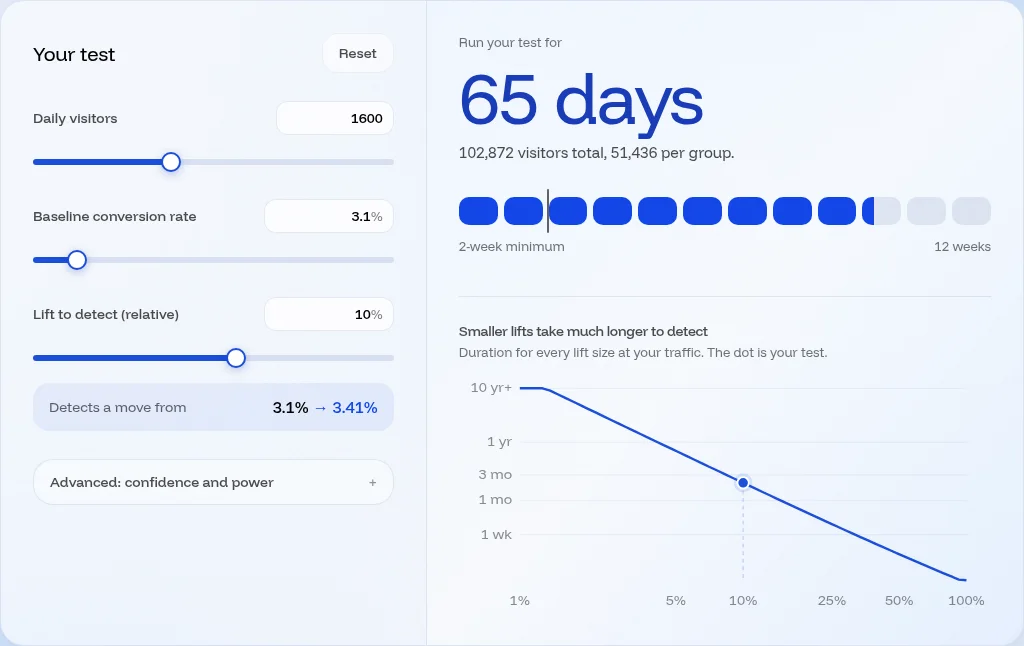
The four inputs that set your sample size
Baseline conversion rate. The rate the page converts at today, measured on the same audience the test will see. If you're testing the product page, that's orders divided by product page sessions, not your store-wide conversion rate. Pull 4 to 8 recent weeks and skip anything that includes a sale.
Minimum detectable effect (MDE). The smallest relative lift you'd act on. A 10% MDE on a 3.1% baseline means the test is built to catch a move to 3.41%. Anything smaller might be real, but the test probably won't see it.
Confidence level. How sure you want to be that a winner isn't noise. At 95%, there's a 5% chance of calling a win when nothing changed. That's the bar we use.
Statistical power. The chance the test catches a real lift of your MDE size. At 80%, one real winner in five slips through as "no difference". Go to 90% when missing a win is expensive, and accept that the sample grows by about a third.
Traffic isn't an input to the sample size. It only decides how long you wait for it.
The sample size formula, worked through
For a conversion rate test with two versions, the visitors you need in each group are:
n = (z_α/2 + z_β)² × (p₁(1 − p₁) + p₂(1 − p₂)) / (p₂ − p₁)²
p₁ is the baseline and p₂ is the rate you'd see with the lift. At 95% confidence z_α/2 is 1.96, and at 80% power z_β is 0.84. Together, (1.96 + 0.84)² is about 7.85.
Say you sell running socks, your product pages convert at 3.1%, and the new PDP layout should be worth at least 10%:
- p₁ = 0.031 and p₂ = 0.0341.
- Variance terms: 0.031 × 0.969 = 0.0300, and 0.0341 × 0.9659 = 0.0329. Together, 0.0630.
- Squared difference: (0.0341 − 0.031)² = 0.0031² = 0.00000961.
- n = 7.85 × 0.0630 ÷ 0.00000961 ≈ 51,400 per version.
Two versions, so 102,900 visitors in total. If the product pages get 48,000 sessions a month, about 1,600 a day, that's 102,900 ÷ 1,600 = 64.3 days, so 65 full days. Round up to whole weeks so every weekday is counted the same number of times: 10 weeks.
You don't need to do this by hand. Our sample size calculator runs the same formula with sliders. The point of seeing it once is the bottom line of the fraction. The lift is squared, which is why small lifts are so expensive.
Smaller lifts cost a lot more traffic
Same store, same 3.1% baseline, same 1,600 product page sessions a day:
| Lift to detect | Conversion rate moves to | Visitors per version | Total visitors | Time at 1,600 a day |
|---|---|---|---|---|
| 5% | 3.26% | 201,000 | 402,000 | about 36 weeks |
| 10% | 3.41% | 51,400 | 102,900 | about 10 weeks |
| 15% | 3.57% | 23,400 | 46,800 | about 5 weeks |
| 20% | 3.72% | 13,400 | 26,900 | about 3 weeks |
A button colour isn't going to move conversion 20%. A product page that finally answers "will it fit, when will it arrive, can I send it back" might. That's the practical use of sample size maths: it tells you which ideas your traffic can afford to test, before you spend two months on one.
Your baseline matters too. At a 6% baseline, a 10% lift needs about 25,700 per version, half of what the 3.1% page needs. Tests closer to the purchase, like the cart or checkout steps, start from higher rates and finish faster.
Revenue per visitor needs a bigger sample
Conversion rate is a yes or no for each visitor. Revenue per visitor isn't. Most visitors spend $0, a few spend $45 and the odd one orders $300 of gifts. That spread is what the sample has to see through.
For revenue metrics the formula swaps the conversion rates for the standard deviation of revenue per visitor (σ):
n = 2 × (z_α/2 + z_β)² × σ² / Δ²
Δ is the lift in dollars. Take the sock store again: 3.1% conversion, a $78 average order and order values that vary by about $60. Revenue per visitor is $2.42 and its standard deviation works out at about $17. To detect a 10% lift in RPV (24 cents), each version needs about 79,000 visitors, half as many again as the conversion rate test.
That's still the metric we'd judge most tests on, because a variant that lifts conversion by pushing shoppers to cheaper items can lose money. Get σ from your own order export rather than a guess, and plan the runtime around the revenue number, not the conversion number.
Running more than two versions
Every version needs its own full sample. An A/B/C/D test with a control and three variants at the 10% lift above needs about 51,400 × 4, so 205,700 visitors, double the A/B test. If you also want to compare each variant with the control at a strict 95%, you need to correct for making three comparisons at once, which pushes the sample higher again.
With a big idea backlog, A/B/n tests are tempting because they clear several ideas at once. They're a fair choice on pages with lots of traffic. On a page doing 48,000 sessions a month, testing one idea at a time usually gets you more answers per quarter, and each answer can shape the next test.
When your store doesn't have the traffic
If the table says nine months, don't run the test anyway and hope. A few options, roughly in order of how often they work:
- Test a bigger change. Combine the delivery estimate, size guide and returns line into one "answer the last question" variant. You learn less about which piece worked, and you get an answer this quarter.
- Test closer to the order. Cart and checkout pages have higher baselines and need fewer visitors.
- Pool similar pages. Test the change on every product page in the template, not one hero product. Shopify's product page templates make this easy, since one template change reaches every product assigned to it.
- Accept a longer test. Fine if nothing else is changing on the page. Not fine across Black Friday, when both traffic and intent shift.
What doesn't work is stopping early when the dashboard says 96% on day six. Checking a test every day and stopping at the first significant reading makes false winners far more likely, which is why the sample is fixed before launch. We run every test for at least two weeks, even when the sample arrives sooner, so a full weekly cycle is counted twice.
Work out your number before the next test
Pull the last six weeks of product page sessions and orders from Shopify Analytics or GA4, and put the baseline and your daily traffic into the sample size calculator. Then drag the lift slider until the runtime is under eight weeks. That lift is the size of idea your store can test right now.
If the ideas on your list won't clear that bar, that's useful to know before you build anything. Cascayd's team researches your store and designs product page and cart tests big enough for your traffic. AI speeds up the build, you approve every test in Slack, and each one gets its sample size set up front, runs at least two weeks and is judged at 95% significance. We only charge when you make money. If you get around 40,000 product page visitors a month, book a call.